8/26—COVID-19 re-infection by SARS-CoV-2 confirmed by whole genome sequencing
Whole genome sequencing was performed directly on respiratory specimens collected during two episodes of COVID-19 in a patient. The second episode of asymptomatic infection occurred 142 days after the first symptomatic episode in an apparently immunocompetent patient. During the second episode, there was serological evidence of elevated C-reactive protein and SARS-CoV-2 IgG seroconversion. Our results suggest SARS-CoV-2 may continue to circulate among the human populations despite herd immunity due to natural infection or vaccination (Kai-Wang To et al. 2020).
Years of Life Lost Attributable to COVID-19 in High-incidence Countries
As of April 22, 2020, there were 1,699,574 years of life lost (YLLs) due to COVID-19 in 30 high-incidence countries. On July 14, 2020, this increased to 4,072,325. Both on April 22 and July 14, the total YLLs due to COVID-19 was highest in the USA (April 22, 534,481 YLLs; July 14, 1,199,510 YLLs), and the YLLs per 100,000 population was highest in Belgium (April 22, 868.12 YLLs/100,000; July 14, 1,593.72 YLLs/100,000).
Vaccines targeting SARS-CoV-2 tested in humans
Vaccines directed against SARS-CoV-2 have been administered to healthy volunteers and have been shown to stimulate a brisk humoral and cellular immune response. All vaccines [3 vaccines in phase 1 trial] were generally well tolerated with mostly mild to moderate local and systemic reactions.
Asymptomatic carriers of COVID-19 in a confined adult community population in Quebec: a cross-sectional study
In our cross-sectional study, 1.82% of 330 asymptomatic confined individuals living in the community carried SARS-CoV-2 despite no contact with declared cases, raising concerns about unnoticed transmission.
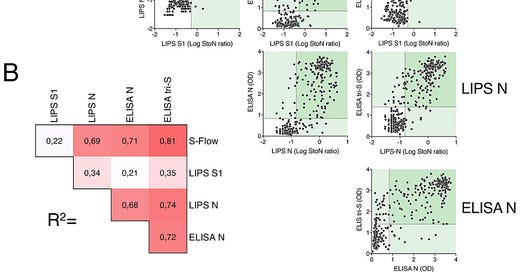
A comparison of four serological assays for detecting anti-SARS-CoV-2 antibodies in human serum samples from different populations
To compare the four serological assays, results from serum samples from mildly-symptomatic individuals and hospitalized patients with COVID-19 (n=329) were pooled. (A) Results obtained with one assay were correlated with those of the other three assays. Dotted lines indicate assay cut-off values for positivity. Values in pale green areas are positive in one assay and values in darker green areas are positive in two assays. Each dot represents one study participant. (B) Pearson correlation coefficient (R2) of each comparison is shown. R2 values are color-coded, white corresponding to the lowest value and dark blue corresponding to the highest value. All correlations are significant (p<0.0001).

Get it by email:
Missed an update? View past issues.

